Analysing Historical Weather
Collecting Data
To start with, we can use the MetOffice’s Historic station data.
There aren’t too many stations offering data, so Eastbourne is closest to me (known as the “Sunshine Coast”, so I expect data to be a bit different to what I perceive north of the downs!).
The data is a text file, located here, https://www.metoffice.gov.uk/pub/data/weather/uk/climate/stationdata/eastbournedata.txt.
Understanding the Data
First import the data. A quick visual shows that we have some introductory text - which we are unable to import (hence using skip). fill is required to cater for missing values.
It turned out that there are 2 rows of headers, and the 2nd row starting with blanks confused the import - therefore we read it for the headers then add those to the main data.
We also have to deal with the ‘Provisional’ text in a column that is not labelled.
.fetch <- function(url) {
  headers <- scan(
    file = url,
    skip = 5,
    nlines = 1,
    what = character()
  )

  data <- read.table(
    url(url),
    header = FALSE,
    fill = TRUE,
    skip = 7,
    col.names = c(headers, "isProvisional")
  )

  return(data)
}

rawEbn <- .fetch( "https://www.metoffice.gov.uk/pub/data/weather/uk/climate/stationdata/eastbournedata.txt") #nolint

str(rawEbn)
## 'data.frame':	763 obs. of  8 variables:
##  $ yyyy         : int  1959 1959 1959 1959 1959 1959 1959 1959 1959 1959 ...
##  $ mm           : int  1 2 3 4 5 6 7 8 9 10 ...
##  $ tmax         : chr  "6.4" "6.6" "10.4" "12.7" ...
##  $ tmin         : chr  "1.1" "2.0" "5.1" "7.3" ...
##  $ af           : chr  "13" "4" "0" "0" ...
##  $ rain         : chr  "109.5" "0.0" "43.0" "62.5" ...
##  $ sun          : chr  "100.4" "73.4" "128.4" "163.5" ...
##  $ isProvisional: chr  "" "" "" "" ...
Cool. We have 763 observations and 8 variables.
Getting Tidy Data
The docs detail some additional characters, that we don’t need. The following characters are removed from the data:
#, use of a different sensor*, ‘estimated’---, more than 2 days missing data in the month
.tidyData <- function(rawData) {
  d <- rawData %>%
    select(
      year = yyyy,
      month = mm,
      maxTemp = tmax,
      minTemp = tmin,
      airFrost = af,
      rain = rain,
      sun = sun
    ) %>%
    mutate(
      across(
        !c(year, month),
        ~ stringr::str_replace_all(.x, c("\\*" = "", "#" = "", "---" = ""))
      ),
      across(!c(year, month), ~ as.double(.x)),
      across(c(year, month), ~ as.integer(.x))
    )

  # only get years with 12 months of data (to prevent totals being skew)
  minYear <- d %>%
    filter(month == 1) %>%
    slice_min(year)

  maxYear <- d %>%
    filter(month == 12) %>%
    slice_max(year)

  d <- d %>% filter(between(year, minYear$year, maxYear$year))

  return(d)
}

ebn <- .tidyData(rawEbn)
Now we have our tidy data, we can ask some questions…
Asking questions
Is there a trend in annual rainfall?
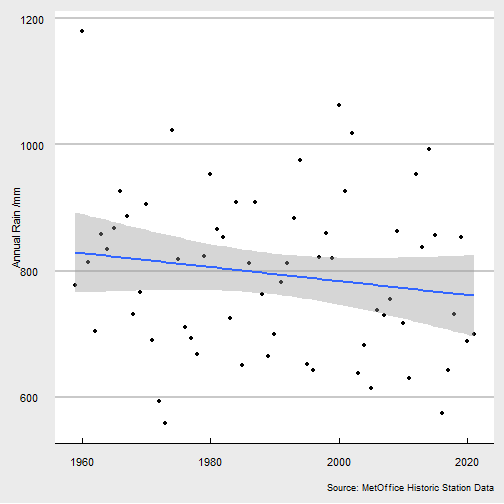
Annual rainfall is pretty random, but there is a notable trend downwards.
Which month has maximum and minimum rainfall?
- Minimum rainfall month was in February 1959, and measured 0mm.
- Maximum rainfall month was in October 2000, and measured 261.1mm.
How does monthly rainfall vary?
Whisker and box plots show median values (for each month) alongside upper and lower quartiles (50%, 25% and 75% respectively). 90% of data is covered between the whiskers. So at a median, 50% of values appear above the line and 50% below.
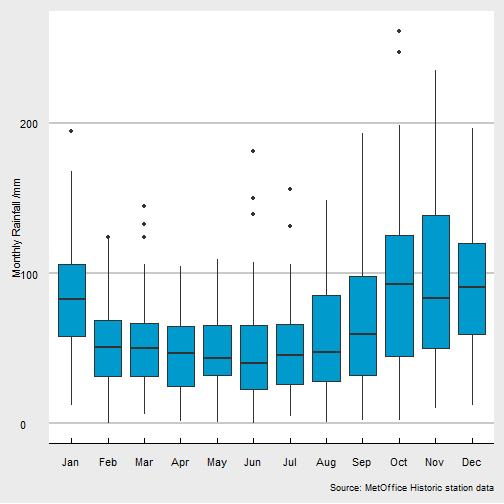
Almost all months have had near zero rainfall. October has the greatest range, from 2.3mm to 261.1mm.
How does monthly sunshine vary?
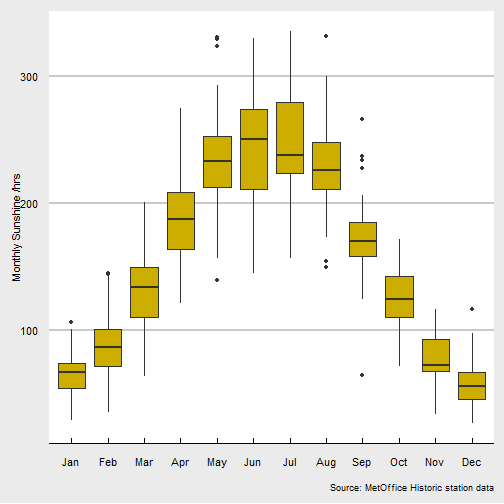
- The least amount of sun in a WHOLE month was in December 1969 with just 26.4hrs.
- The most amount of sun was in July 2006 with 335.3hrs.
- September has the greatest range of sun, which has had between 64.9hrs and 265.8hrs.
These values include ‘outlier’ data (outside of the 90% likleyhood). Although I am not presenting actual quartile data here, you can see from the boxplot above which month is most LIKELY to have a wide range of sun hours.
For Eastbourne, this is June.
Are maximum / minimum temperatures ‘related’?
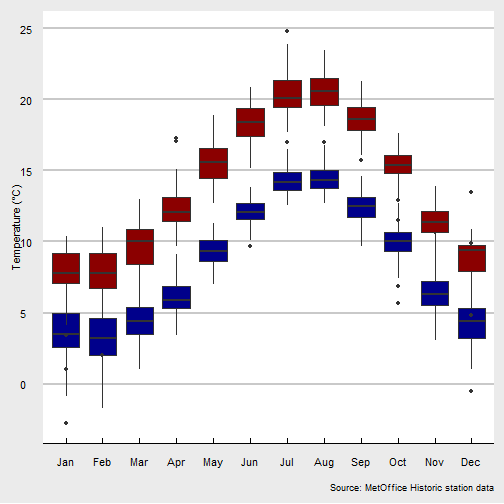
Yes.
Do years have varying temperature range?
The minimum minimum to the maximum maximum of each year.
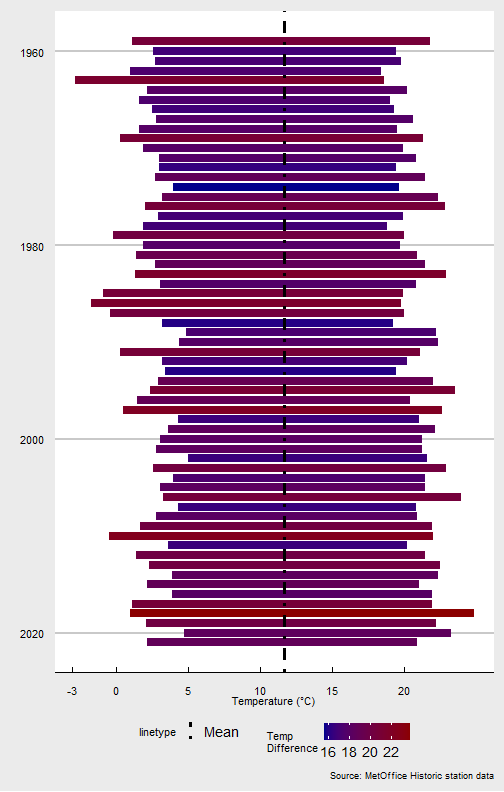
- Minimum temperature range is 15.6°C in 1974, with a minimum of 4°C and maximum of 19.6°C.
- Maximum temperature range is 23.8°C in 2018, with a minimum of 1°C and a maximum of 24.8°C.
Create a Play-Thing
All Weather
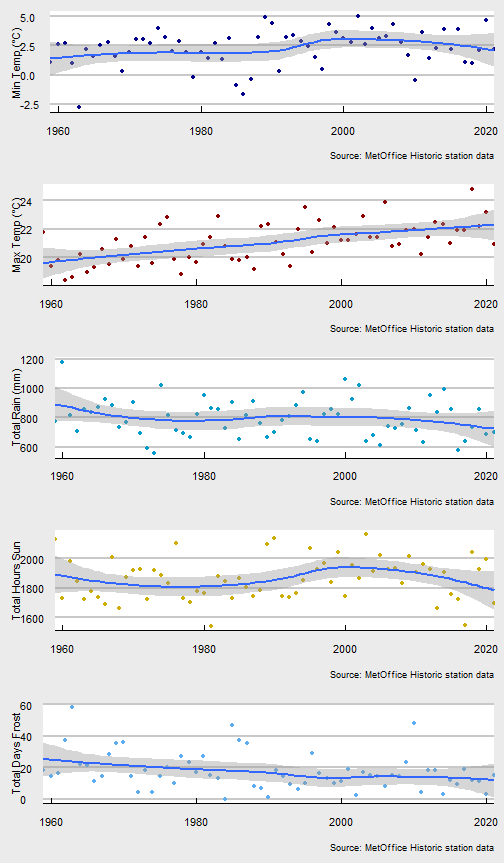
Remember that temperatures are the mean daily maximum/minimum for the month. Rain, sun and frost are the sum of mm, hours, days (resp).
UPDATE: It seems that I cannot render to HTML if I connect them all and make them interactive :o( So here they all are static…
